

Glassity
Making AWS cloud architecture more understandable through isometric visualisation and chatbot-supported insights
The challenge
Cloud infrastructure is difficult to understand, especially for stakeholders without an engineering background. Existing cloud management tools rely on technical terminology, complex dashboards, and manual analysis, making it difficult to identify resource usage, cloud waste, and optimisation opportunities.
Glassity wanted to create a more intuitive way to explore AWS infrastructure by combining interactive 3D visualisation with conversational AI, making cloud data easier to understand for both engineers and decision-makers.
Methods
Desk Research, Research through Design, Concept Development, Interactive Prototyping, User Interviews, A/B Testing, Thematic Analysis, Usability Testing
Team
Evgenia Novoselova, Haris Ali Baig, Mattia Quartana, Kevish Motee
Duration
3 Months
Research
The project followed a research through design approach, combining literature review, concept exploration, iterative prototyping, and user testing to discover the most effective way of visualising cloud infrastructure.
→ Desk research
Research on cloud data visualisation, AI transparency and conversational interfaces was reviewed to find clear ways to present complex cloud data to both technical and non-technical users.
→ Concept exploration
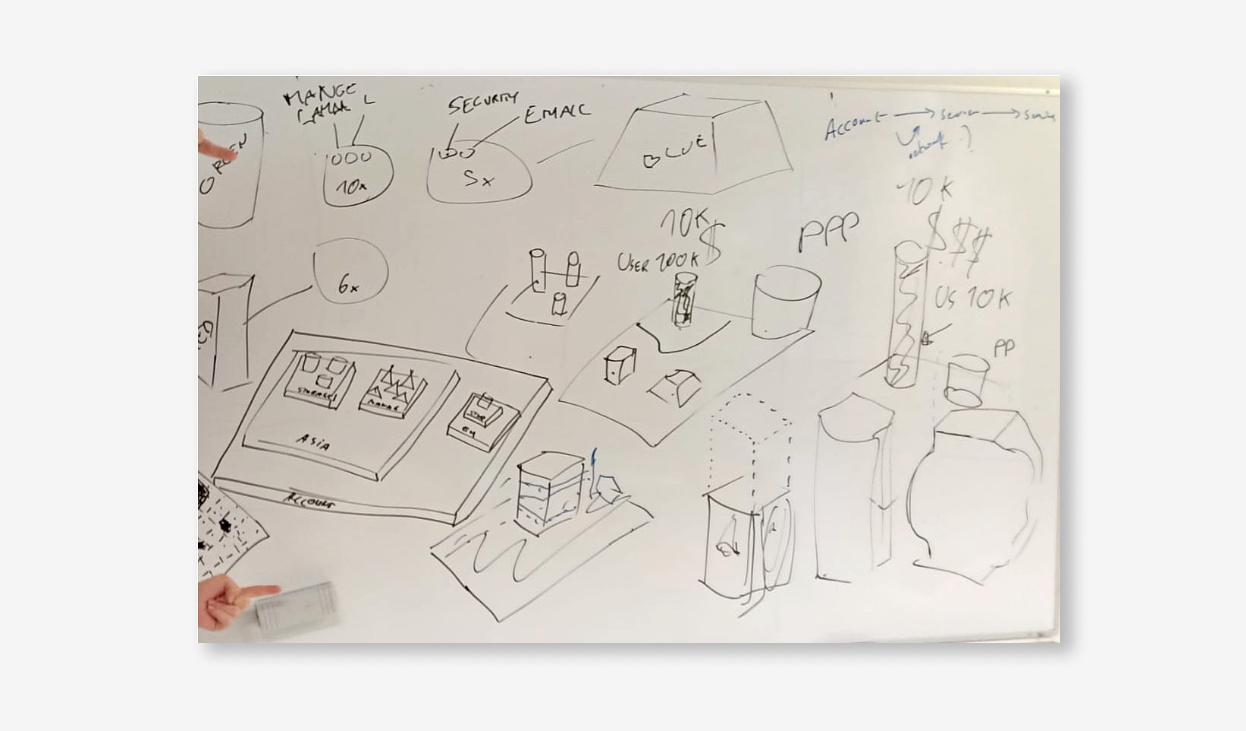
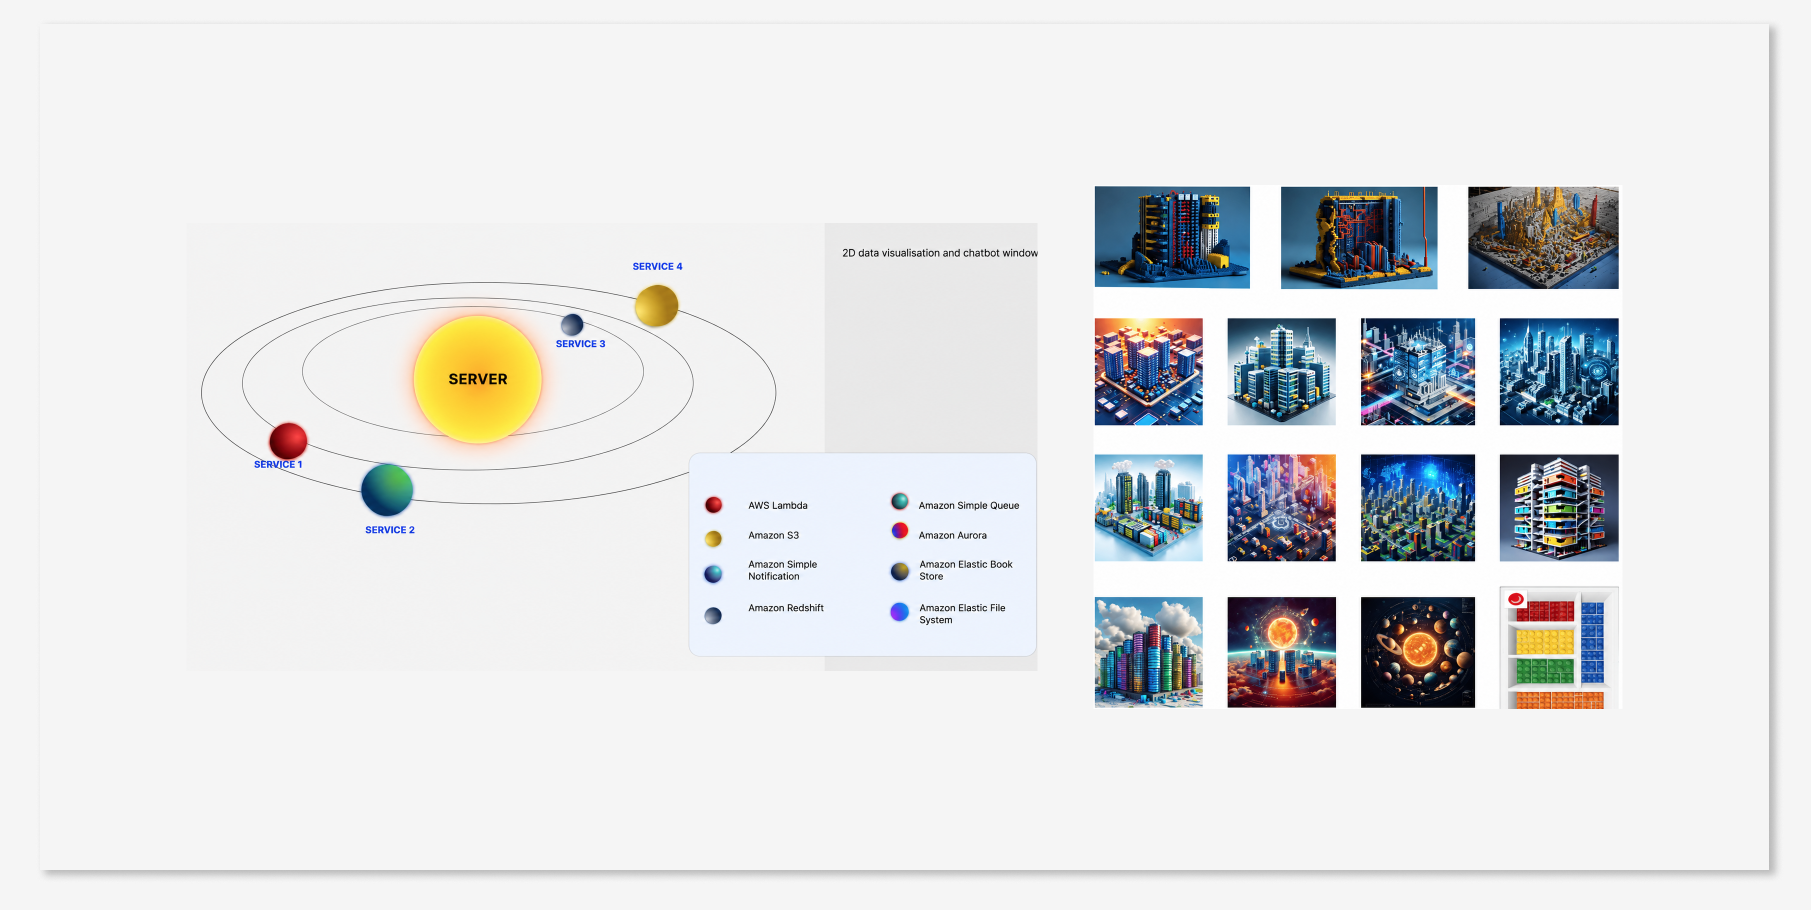
Multiple visual metaphors were explored to represent cloud infrastructure, including building-based concepts and a solar system metaphor inspired by existing research. These concepts helped the team evaluate different ways of making complex cloud architecture easier to understand.
→ Research through design
The project followed a Research through Design approach, using iterative prototyping, testing, and reflection to explore and refine design ideas. Insights from each iteration informed the next, guiding the development of the final high-fidelity prototype.
→ User Research
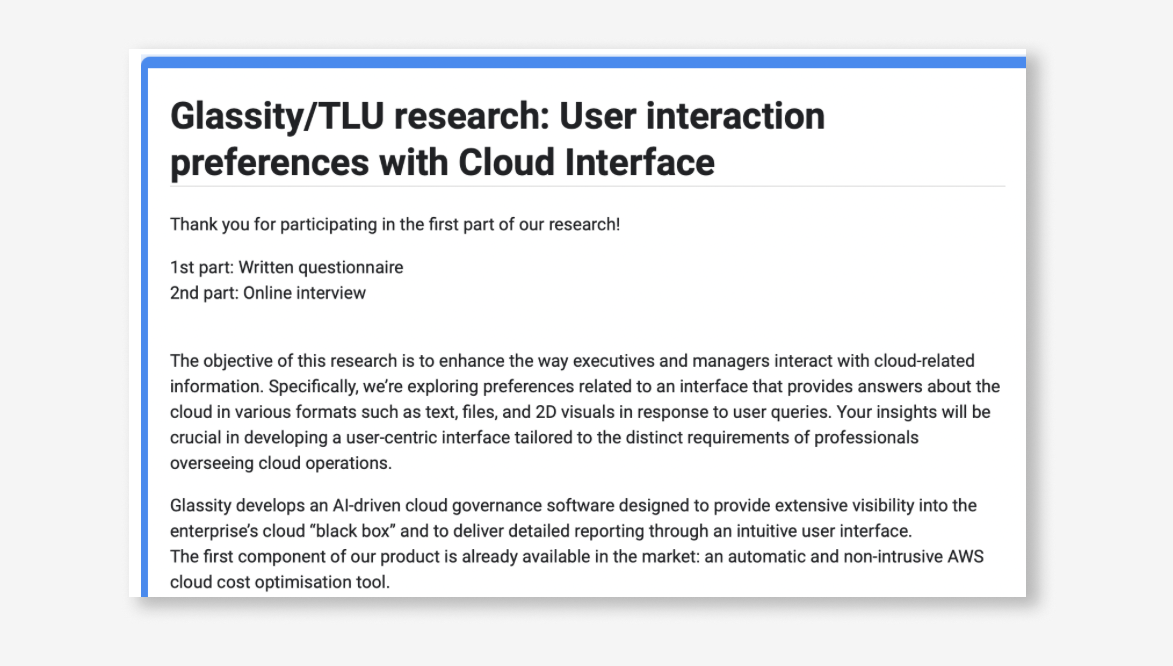
Questionnaires, interviews and prototype testing with CTOs, cloud engineers and other cloud professionals explored how users understand cloud data, what information is most important to them and how visualisations can support decision-making. Participants also evaluated different ways of visualising cloud resource usage.
Key Insights
→ Cloud usage should be immediately visible
Participants wanted important information such as overused and underused resources to stand out instantly without reading detailed metrics.
→ Simplicity matters more than realism
Users preferred clear visual representations over highly realistic graphics. Recognisable shapes, colours, and hierarchy made cloud architecture easier to understand.
→ Cost-related information is the highest priority
Cloud spending and resource optimisation were consistently identified as the most valuable information for both technical and business stakeholders.
→ AI should explain, not replace
Participants appreciated the chatbot as a way to quickly answer questions and generate reports, while the visualisation provided context and overview.
→ Visual hierarchy improves understanding
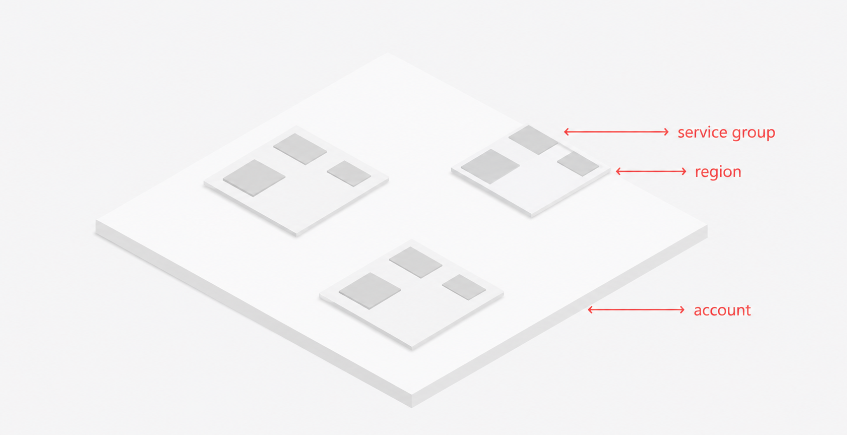
Representing cloud architecture as Accounts → Regions → Service Groups helped users understand relationships much faster than traditional dashboards.
Design Solutions
Based on the research findings, the final concept combined interactive isometric visualisation, contextual colour coding, and a chatbot interface to make complex cloud infrastructure easier to understand and navigate for both technical and non-technical users.
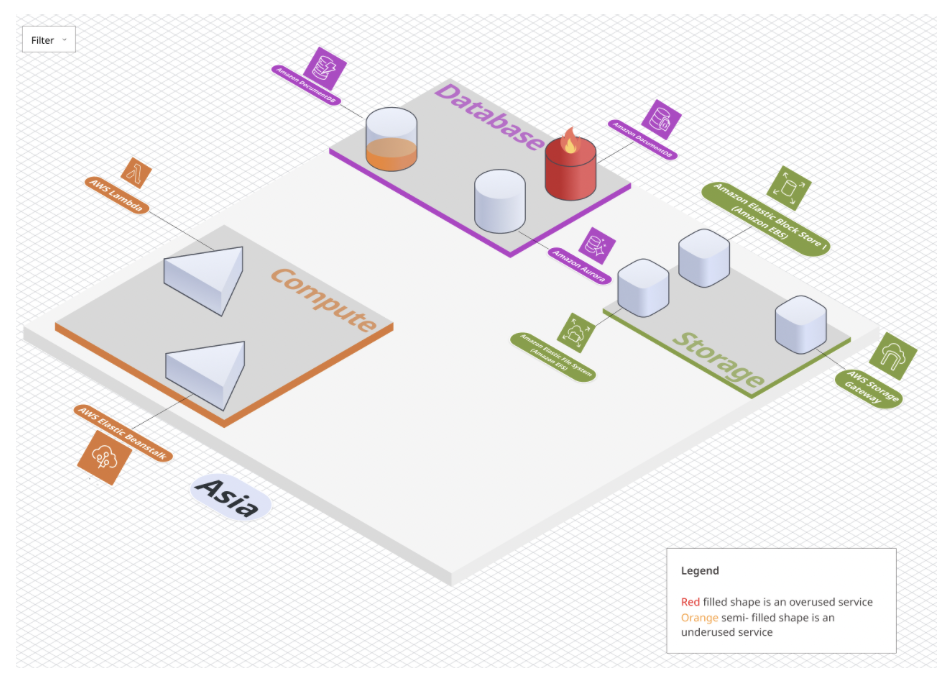
→ Isometric cloud visualisation
Problem – Traditional dashboards display large amounts of technical information that can be difficult to interpret.
Solution – An interactive isometric visualisation was designed to represent AWS architecture hierarchically, allowing users to gradually explore more details through zooming and interaction.
→ Clear representation of resource usage
Problem – Users struggle to identify which cloud services required attention.
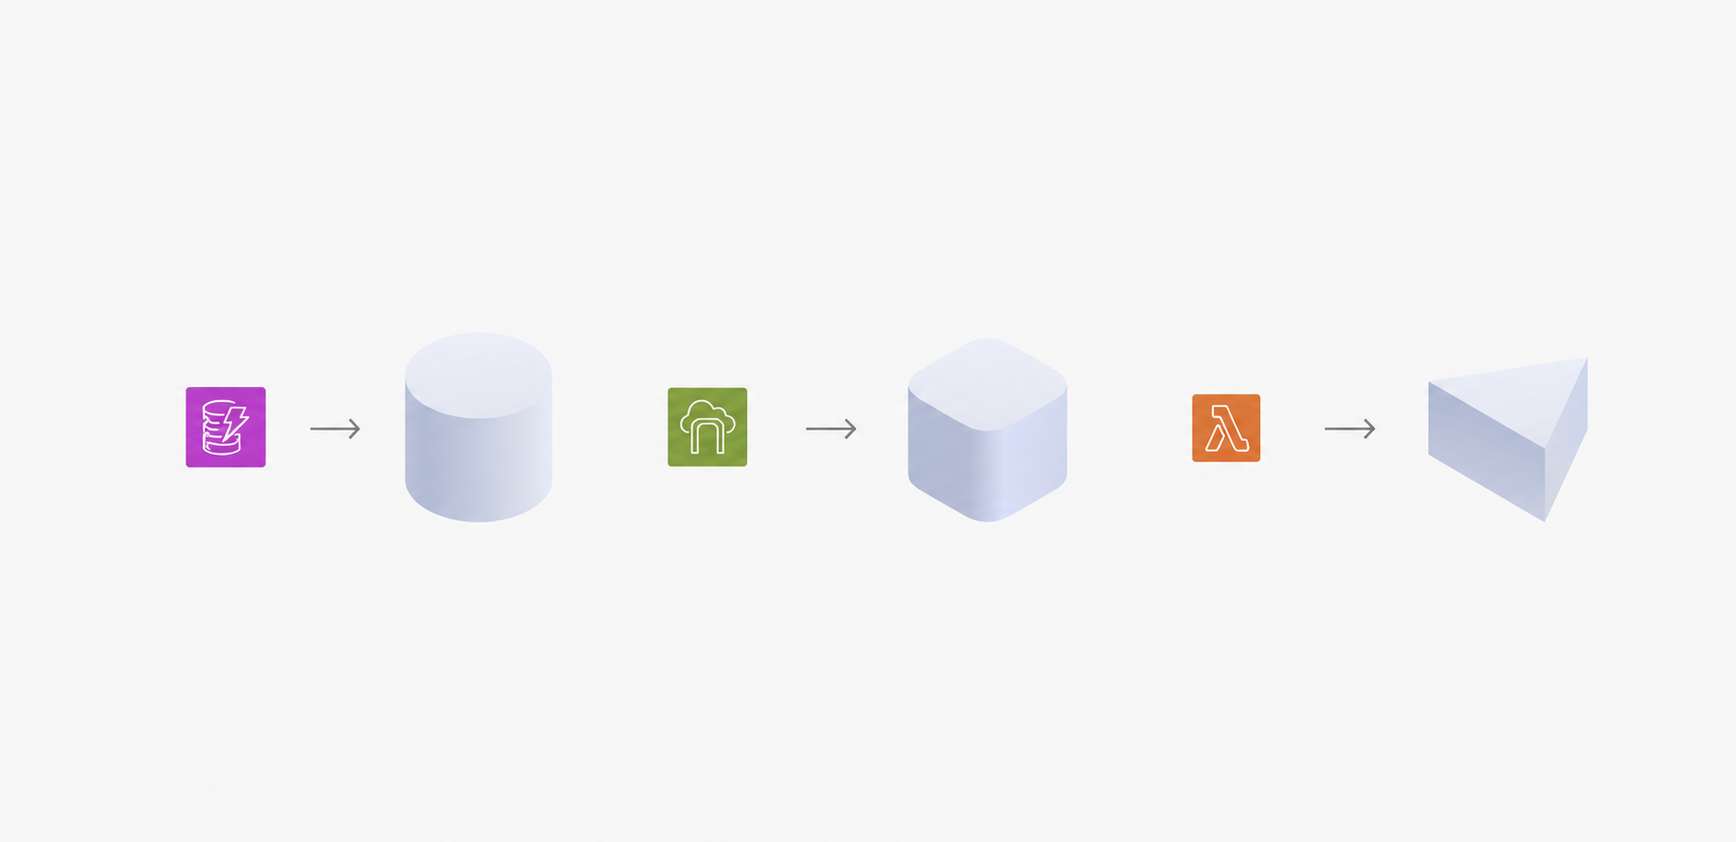
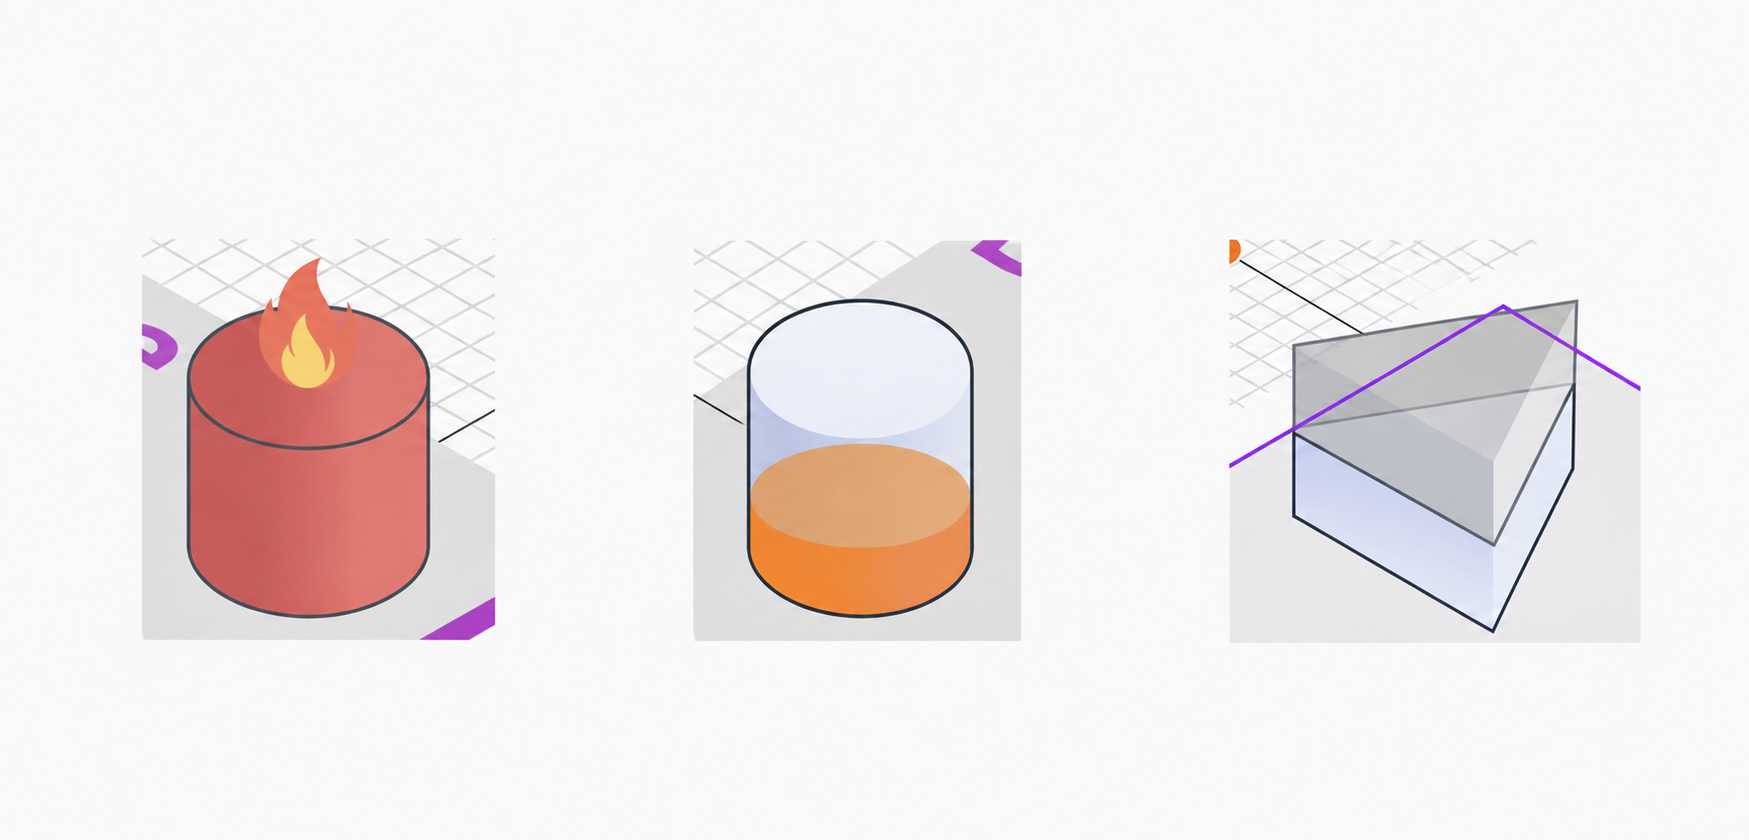
Solution – Several concepts were tested before selecting a combination of colour, icons, and simplified visual states to distinguish overused and underused resources.
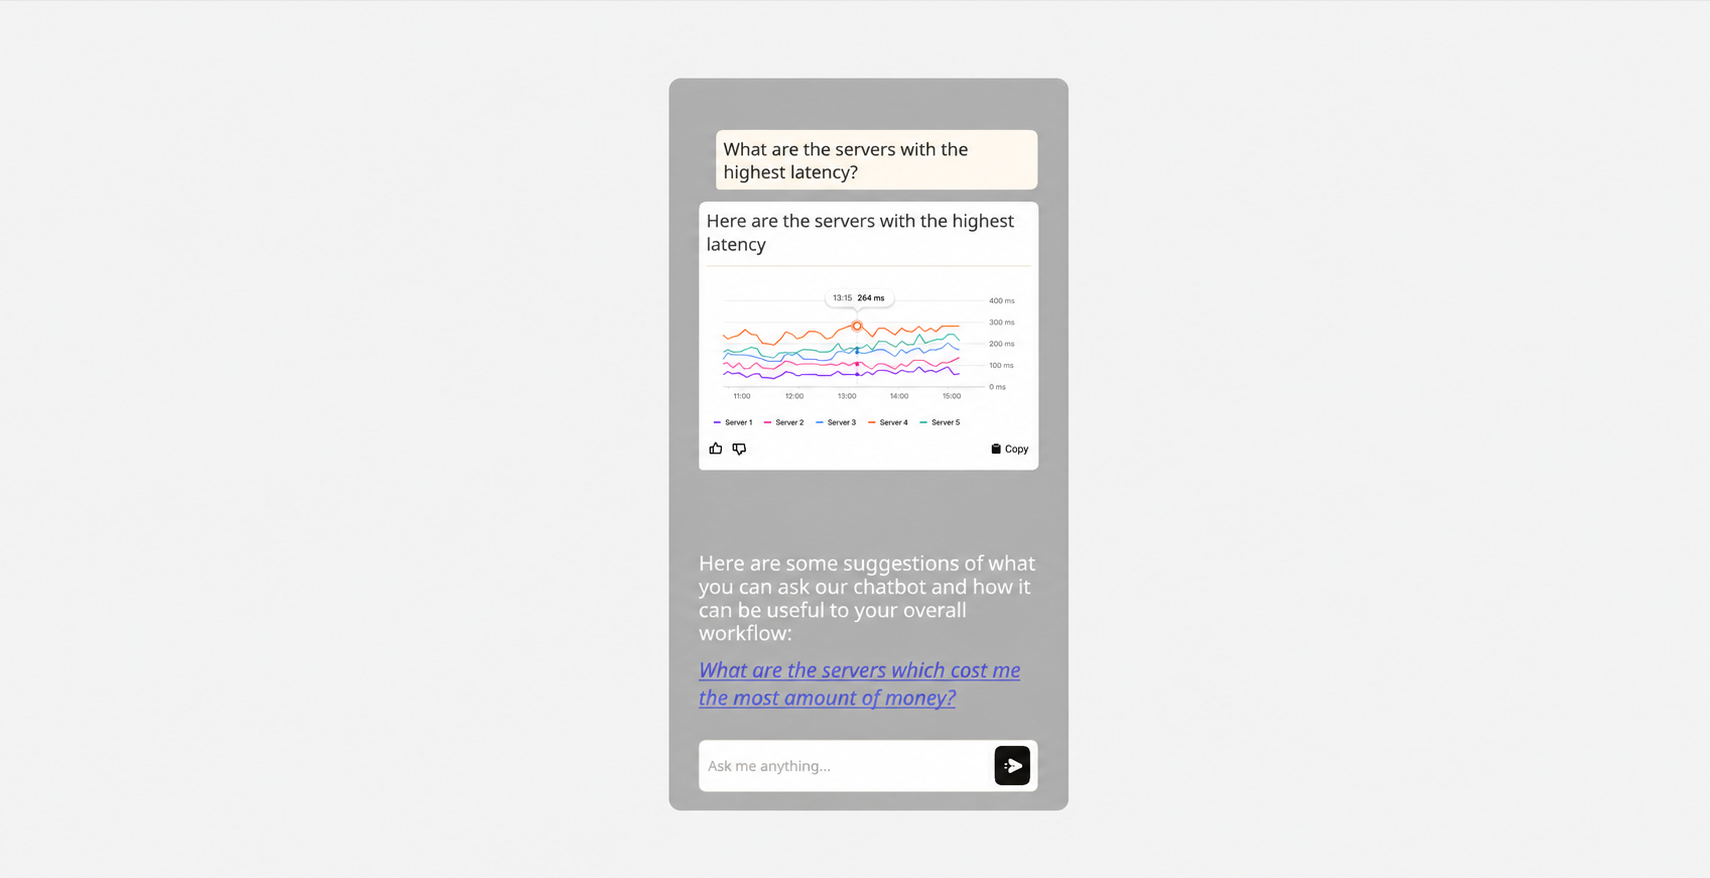
→ AI Chatbot & reports
Problem – Finding specific cloud information often requires navigating multiple dashboards.
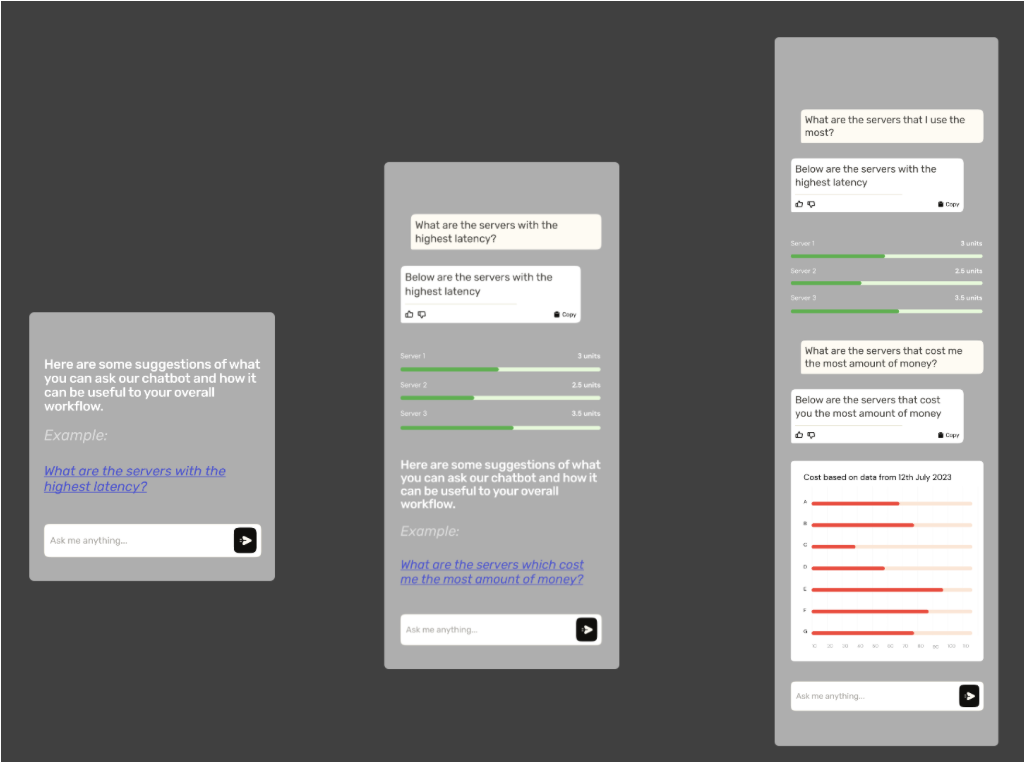
Solution – An AI chatbot was introduced to answer natural language questions, explain cloud resources, and generate visual reports that support decision-making.
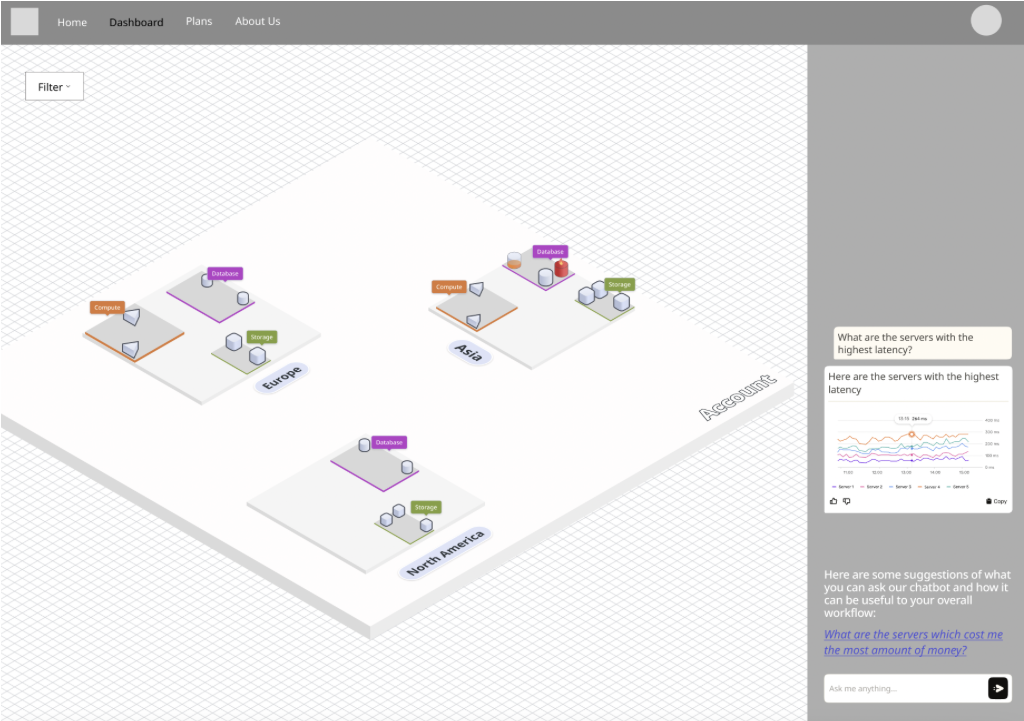
→ Unified dashboard
Problem – Cloud information was previously spread across multiple tools and interfaces.
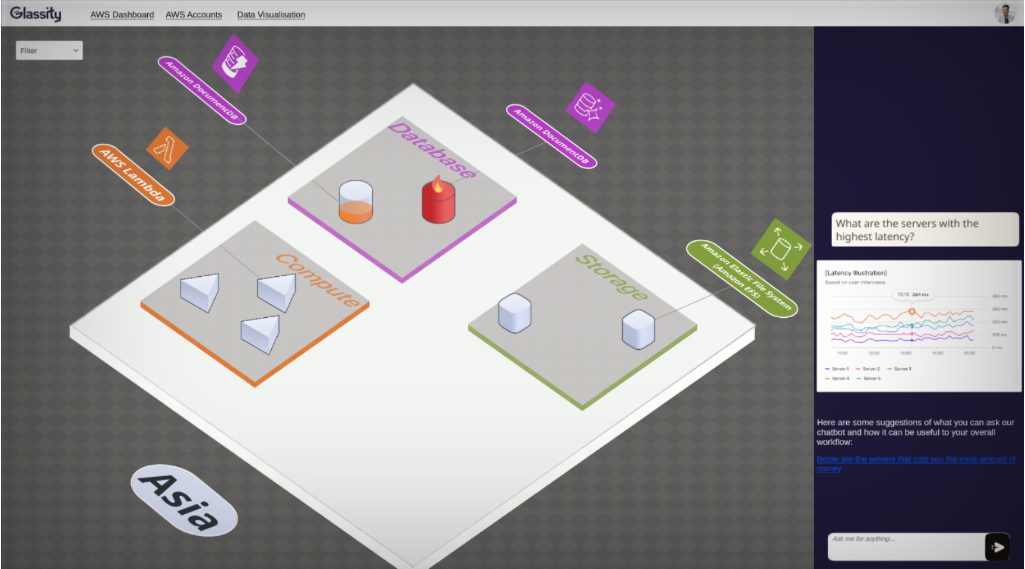
Solution – A single dashboard combined the 3D visualisation, chatbot, and supporting charts into one workspace that helped users understand cloud infrastructure more efficiently.
Usability Testing
The prototype was evaluated with cloud professionals through interviews and usability sessions. Participants preferred simple visual indicators over more decorative alternatives, found the information hierarchy easier to understand, and valued the chatbot as an additional way to explore cloud data. The findings informed several design refinements, including clearer visual representations of resource usage, improvements to the overview and dashboard, and updates to the chatbot interface.
Outcome
The project explored how interactive visualisation and conversational interfaces can make complex cloud infrastructure easier to understand for both technical and non-technical users. Research findings informed a high-fidelity concept that combined hierarchical isometric visualisation, contextual resource indicators, and a chatbot to support the exploration of AWS environments.
The final outcome was a research-informed high-fidelity prototype supported by recommendations for the future development of the Glassity platform.